【Bitmidas Weekend Special】Bitcoin Trend Analytics 12th March 2022
BTC/USD, using Investing data flow for the analysis.

Recap
Yesterday, we mentioned that the price would be confined within the range between 42421.6~37017.70, centering 39846.10 and we would see a wrestle at the center.
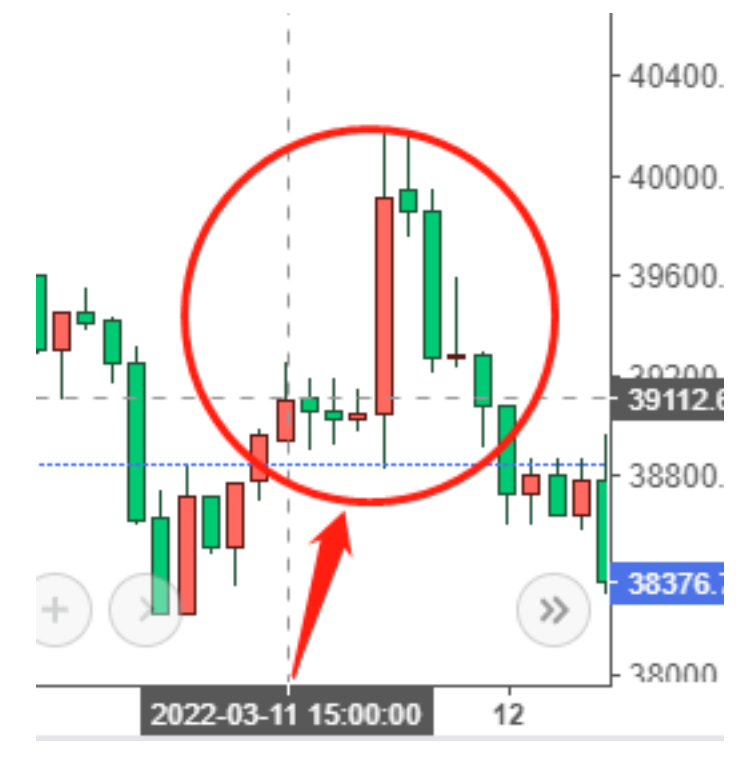
From 15:00–22:00, the price was trying to break up 39846.10 but failed. The lowest price came back to 38236.4, supported by 38495. The highest price then touched 40177 and fall back under the pressure at 40519.5.
The opening price today is 38730.2 (08:00 UTC+8)
Market Analysis
As BTC is still running within the congestion and maintaining a similar momentum and level range, I suggest you keep focusing on the points suggested previously. The weekend is a good time to refresh, so I’ll do a general market analysis instead.
Looking back from Feb 28th to Mar 1st, when Russia invaded Ukraine and sanctions were put on crypto-assets for Russian, we saw a large inflow of buying orders of 4k BTC based on reliable news and stats. BTC price was quickly pulled up to 41500~42000 from 38000 and reached 44900~45000 on Mar 1st.
Many people believed that BTC finally came to be a safe-haven asset like gold and was back on a bullish track. But the reality gave them a hard blow — BTC price plunged quickly to the key support area of 37017.70 on Mar 7th.
On Mar 9th, a piece of news indicating a positive attitude of the US Treasury on crypto-assets lit up the market. A good bounce-back seduced many to open long positions. The reality again dampens the bullish spirits. Lessons learned from this is following the rules of statistics.
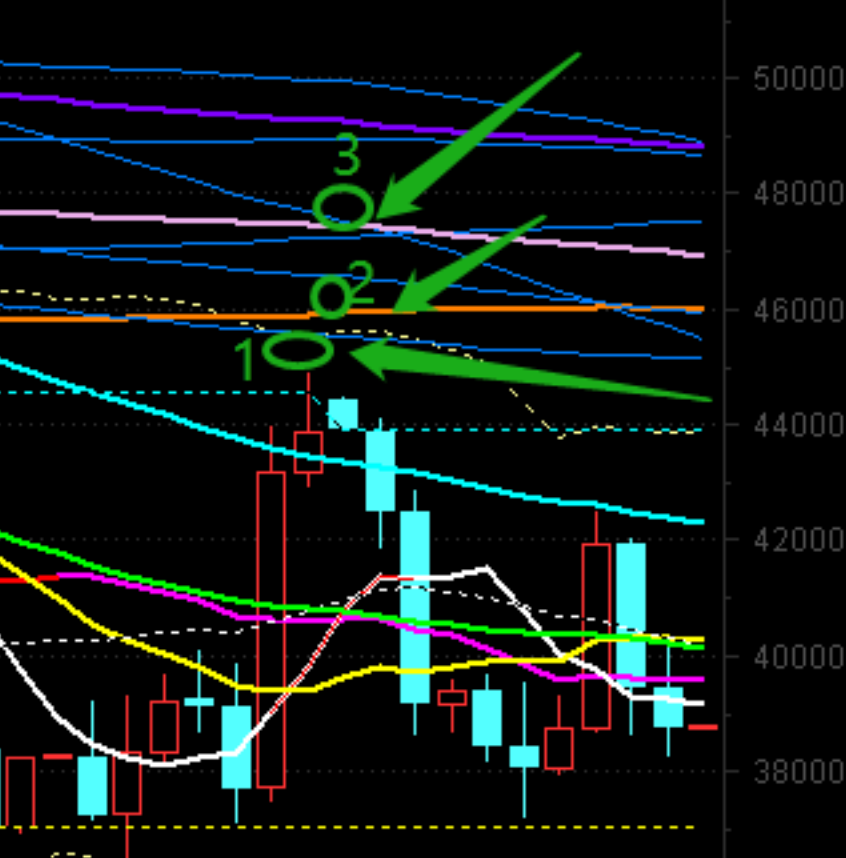
On 1d frame, I have 3 downtrend lines suppressing the price each day from Feb 28th to Mar 1st based on my algorithm.
It’s clear that a resistance based on my calculation prevented the price from rising during the days on Mar 9th and 10th. On that day, a friend asked me how Biden’s executive order would be interpreted in crypto, my reply was that it’s positive to the crypto market as a whole, but price should still run within the congestion in the short term. The fact of the price drop on Mar 10th speaks itself as we depicted it in statistics.
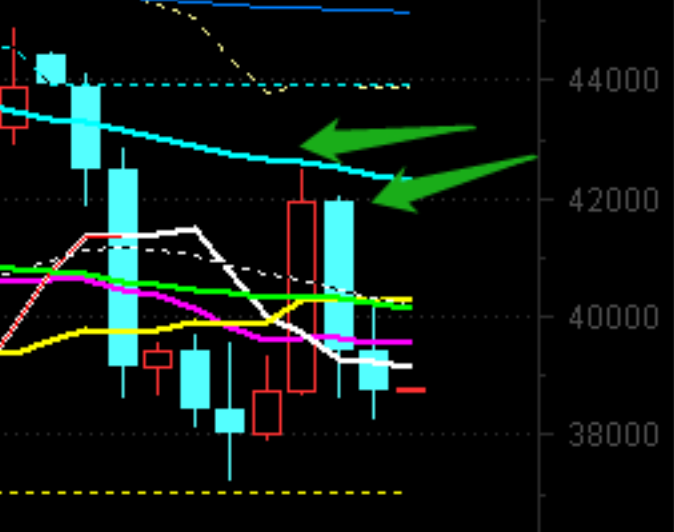
On 1w frame, you can see the red line resistance is there preventing the price from rising above it. Take a special look at the bounce on Mar 9th, that line, based on my calculation, takes a stronghold of resistance.
All the resistances and supports are shown as lines on chats. What lies behind them is the battle between longs and shorts of speculators, and they change their positions according to the market trend. One piece of news is hard to shift the market in a short period of time.
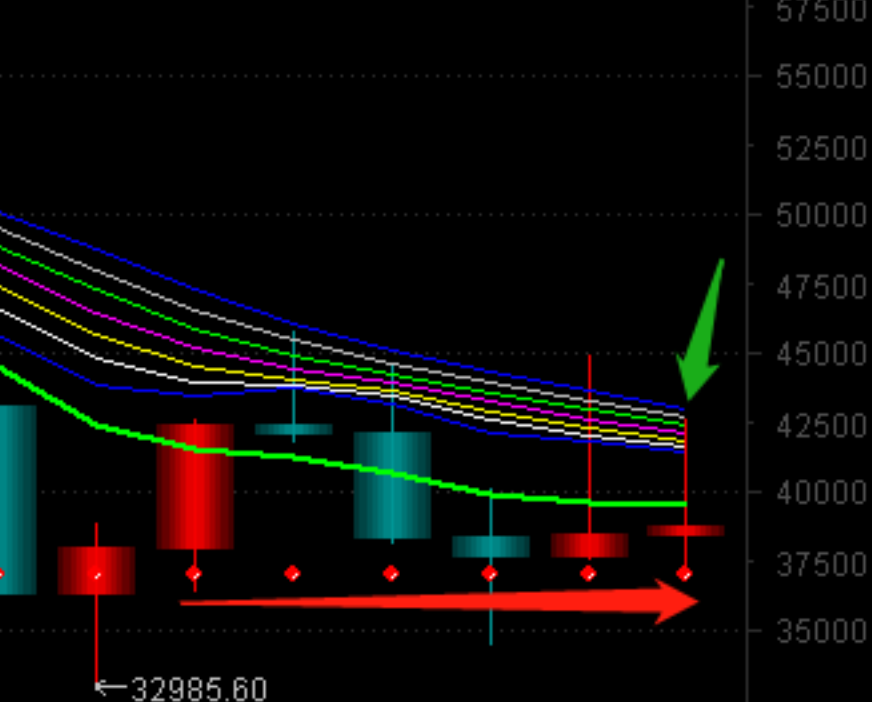
Therefore, before making any breakthroughs, the market will still be running within the congestion.
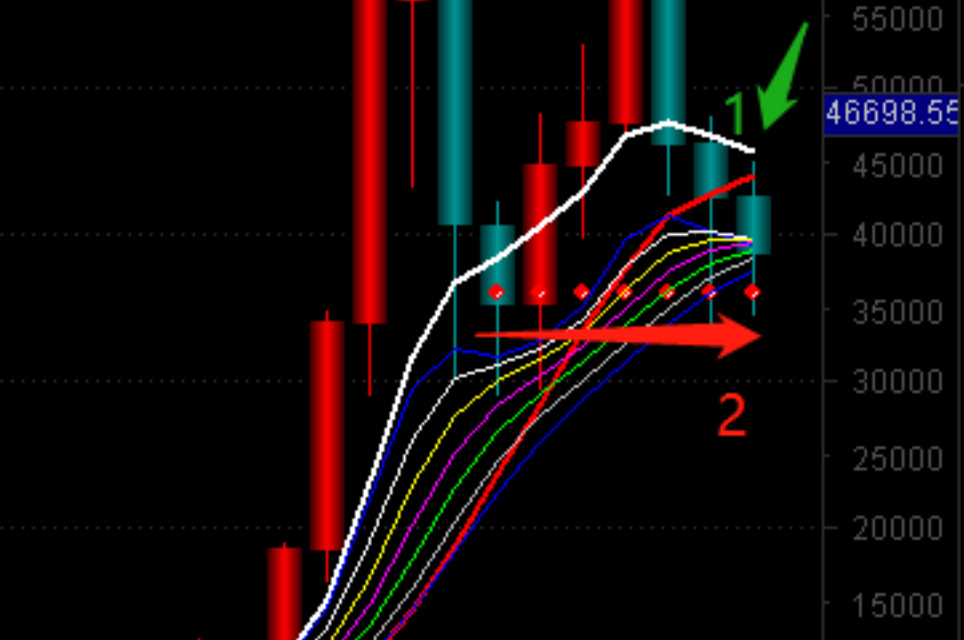
On a 1 month frame, we are clearly in between a key resistance (indicated by 1) and support (indicated by 2) range. It’s hard to tell which side will quickly win out. So the price will keep bouncing back and forth within a large congestion area.
This type of movement will be shown as a hike or a dump on a 1d frame, often caused by a piece of news.
I shared my opinion from the first day of 2022 when there was a similar market trend, but I didn’t write it down and publish it on Twitter. Now I decide to make an extra effort to share my experience with more friends in crypto. Hope you like it, see you next week.
Follow us on https://twitter.com/BitMidas to get instant daily updates!
1.资讯内容不构成投资建议,投资者应独立决策并自行承担风险
2.本文版权归属原作所有,仅代表作者本人观点,不代表本站的观点或立场
您可能感兴趣
-
 事到如今最对不起家人,币圈高手们在股票市场栽了个跟头
作者:Zhou,ChainCatcher“事到如今,最对不起的就是家人”。 最近听到这句话的频率,不亚于两个月前的“你相信光吗”、“你要站在光里,而不是光站在那里”。 简短两句话道出了180°反转的行
-
 Castle Labs:六大协议今年赚了 74 亿美元,为何币价还在跌?
作者:Castle Labs 编译:佳欢,ChainCatcher 今年以来,加密协议累计创造了 74.2 亿美元收入。即便交出了如此亮眼的数字,大多数加密代币的价格依然没有反映出协议本身的成功。 原
-
破产:从 1.63 亿美元欠条危机,看为何平台钱包并非安全") 深度复盘币印(Poolin)破产:从 1.63 亿美元欠条危机,看为何平台钱包并非安全
深度复盘币印(Poolin)破产:从 1.63 亿美元欠条危机,看为何平台钱包并非安全2026 年 7 月 22 日,总部位于新加坡的加密矿池巨头 Poolin(币印)及其关联公司正式在美国新泽西州破产法院申请了 Chapter 11 破产保护。[1] 根据最新披露的法庭文件,Pool
-
 欢迎来到新币圈:只不过这次,亏钱的地方叫股市
撰文:豆丸了2026 年 7 月 13 日,首尔。 韩国综合指数 KOSPI 单日暴跌 8.95%,年内第 7 次熔断。SK 海力士,韩国人眼里的"国运股",单日重挫 15.37%,近二十年没见过这么
-
 Meta 的 AI 账本:608 亿营收为何撑不住股价?
Meta二季度营收608亿美元,创历史新高,同比增长28%。盘后跌7%。同一天发财报的微软,云业务超预期,盘后涨超8%。Meta的营收也超越了华尔街一致预期,广告收入594亿美元,增速27%,广告展示
-
 火币HTX《VIP守护者计划》|Yarra:守护每一次交易体验
《VIP守护者计划》是火币HTX推出的系列访谈栏目,聚焦大客户服务实践,每周二邀请平台一线服务团队分享真实服务经历、市场观察及客户需求洞察,传递长期主义的服务理念,展现火币HTX专业、稳健的客户服务能
-
 三星电话会:存储供不应求“明年比今年更紧张”,60-70%产能已分给长期协议,HBM4收入将占六成
作者:董静在生成式AI与Agentic AI(代理型AI)需求的强力驱动下,三星电子2026年第二季度交出了一份极具爆发力的答卷。 财报数据显示,三星电子当季实现营收171.5万亿韩元,同比暴增130
-
 美股芯片半导体跌跌不休,到底要回调到什么时候?
近来美股的存储芯片板块抛售,已经不能用单纯的"回调"两个字来形容了。昨晚,SK海力士、美光、闪迪这些昔日的芯片明星股继续集体下挫。费城半导体指数(SOX)从一个月前14,600多点的高位,一路跌到目前
- 成交量排行
- 币种热搜榜
 泰达币
泰达币 比特币
比特币 以太坊
以太坊 USD Coin
 Solana
 瑞波币
瑞波币 Ronin Network
 币安币
币安币 World Liberty Financial USDv
 莱特币
莱特币 艾达币
艾达币 狗狗币
狗狗币 大零币
大零币 Wormhole
 比特现金
比特现金 SHIB
SHIB UNI
UNI OKB
OKB AR
AR ICP
ICP DOT
DOT LUNC
LUNC YGG
YGG DYDX
DYDX LPT
LPT ETC
ETC