【Bitmidas】Bitcoin Trend Analytics 25th March 2022
BTC/USD, using Investing data flow for the analysis

Time of Analysis 08:55 UTC+8
Time of Translation & Publication 11:00 UTC+8
Recap:
Yesterday we saw an increase of long positions in stats, forcing shorts backward. As it stood firm above 41948.69, BTC was in a condition to break up 43912.8. When 43912.8 is broken, the first resistance is at 44762.99.
As we can see from the chart, BTC stood at 42500 above 41948.69 and then rallied towards 43912.8, yet suppressed by the resistant band at 44762.99.
The opening price today is 44013 at 08:00 UTC+8
Trend Analysis:
Now BTC breaks out the congestion yet solid above 43912.8. 44850.31 has been a strong resistance. Within a short period after 8:00 (UTC+9), the price would oscillate around 43912.8 and try to stand firm before rallying to 44850.31. It’s quite common to see the price rise above or come underneath 43912.8.
As it breaks the upper resistance of the congestion, BTC maintains a bullish momentum in a short term. The bullish support came to 42551.71~42718.13 from 41948.69, with its core at 42551.71, diversion at 42718.13.
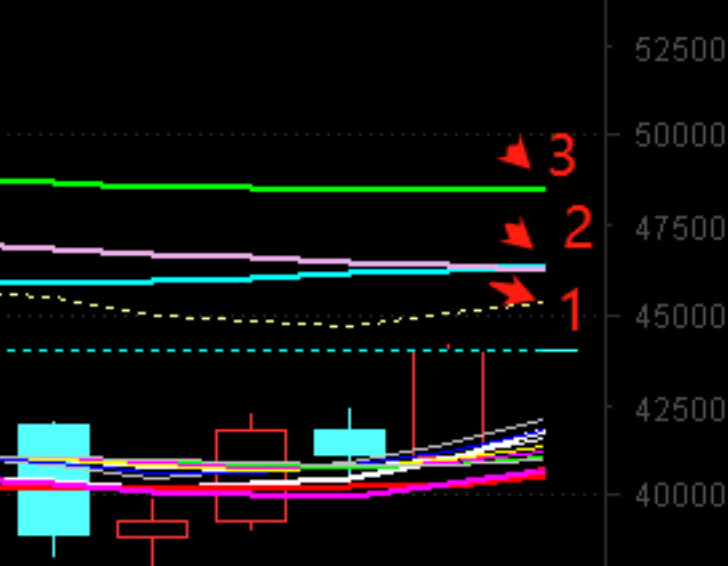
Next, we have multiple resistance above: 45423.84, 46359.31, and 47703.59.
Today, BTC will first move between 42551.71~45423.84, centering 43912.8 for some time. Previous resistance at 44850.31 will be weakened during this process and lose its strength in the analysis today.
There is only 1 level range to focus on today:
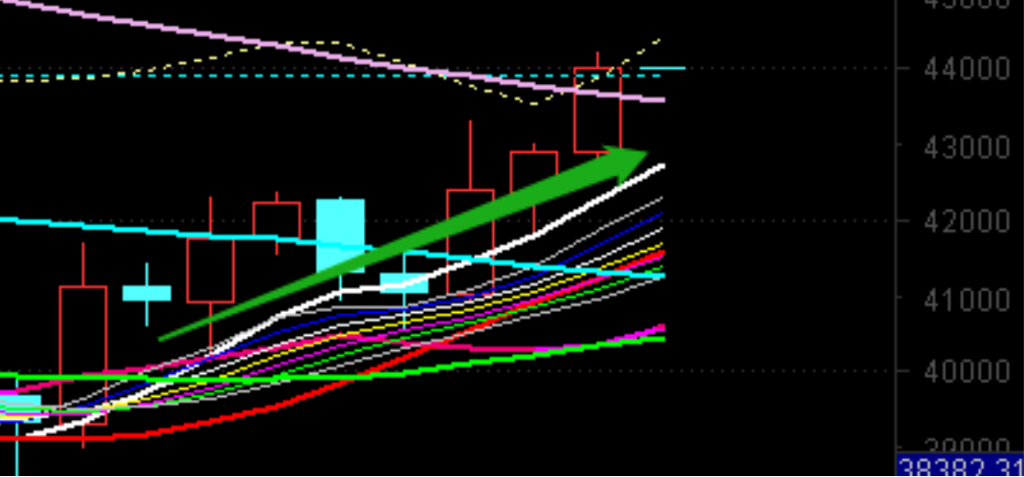
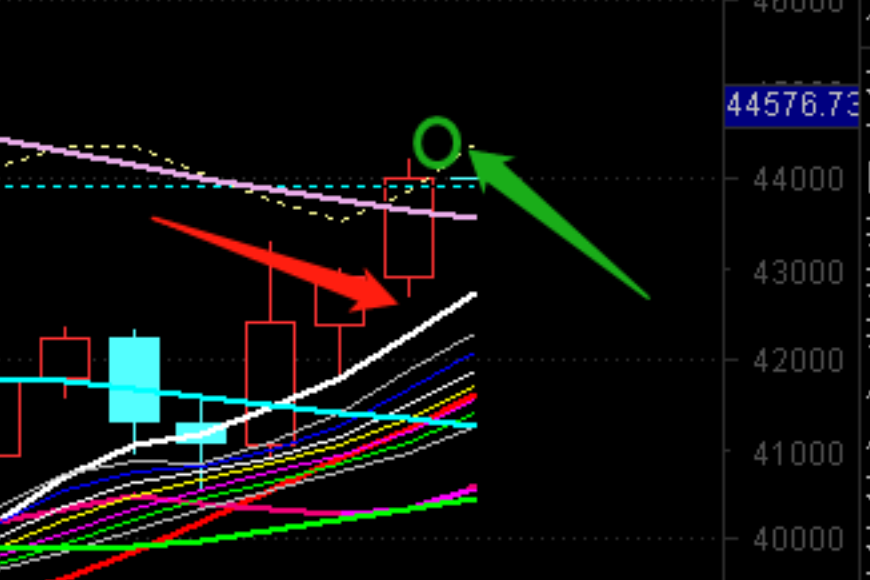
1. The short-term support at 42551.71. In fact, there is a support zone between 42551.71~42718.13. As long as the core support keeps diverting upward, the bullish momentum continues. As indicated by the green arrow in the chart, the core support resulting from our algorithm has been diverting upward for some time till now.
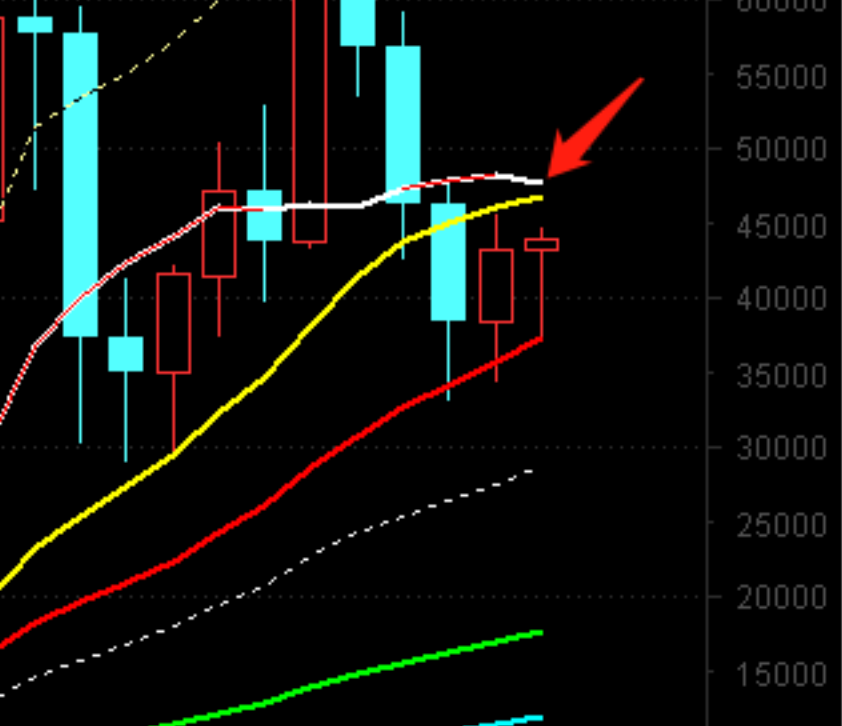
Currently, BTC is in correction among a long-term bullish trend. Only by breaking the calculated resistance (indicated by the red arrow) could BTC see a full recovery of the bullish trend. Before that, the price would move upward incrementally between key supports and resistances.
Supports:
43453.32; 43096.79; 42718.13~42551.71; 42008.58; 41394.66; 40821.84; 40550.31; 39725.66; 38950.05; 37371.02~37047.73; 36946.25 (pointless to see further down atm)
Resistances:
44850.31; 45423.84; 45843.53; 46359.31; 47703.59; 48181.91; 48719.63; 49742.48; 50843.93; 51606.97; 53821.93 (pointless to see further above atm)
Follow us on https://twitter.com/BitMidas to get instant daily updates!
*Not Financial Advice.
1.资讯内容不构成投资建议,投资者应独立决策并自行承担风险
2.本文版权归属原作所有,仅代表作者本人观点,不代表本站的观点或立场
您可能感兴趣
-
 交给曲线,别和周期对抗:宏观分析大师 Raoul Pal 的加密 10 年投资复盘
作者:Raoul Pal,Real Vision 联合创始人兼 CEO 原标题:《Where Crypto Fits in the Exponential Age》 编译:胡韬,ChainCatche
-
 Visa 最新研究: 1.1 亿笔交易背后,Agent 支付正在重构互联网商业
作者:Tim Conard(Visa 链上数据负责人)、Lucas Shin(Artemis 数据与研究) 编译:佳欢,ChainCatcher 前言 Artemis 是链上数据领域的分析平台,Vis
-
 CLARITY 法案的“最后一公里”为何走不通?
作者|Odaily 星球日报 jk《数字资产市场结构法案》,(Digital Asset Market Clarity Act,即 CLARITY 法案)自 2025 年 7 月 17 日以 294
-
") Bitget UEX 日报|伊朗突袭美军基地油价反弹;存储芯片继续重挫;苹果与微软、谷歌等稳健上涨 (2026年07月29日)
Bitget UEX 日报|伊朗突袭美军基地油价反弹;存储芯片继续重挫;苹果与微软、谷歌等稳健上涨 (2026年07月29日)一、热点要闻 美联储动态 决议前市场分歧显著,加息预期升温联邦基金利率期货未平仓合约激增至历史新高(周一达96.7万份),反映交易员对政策路径的巨大分歧。 CME数据显示,7月维持利率不变概率69.5
-
 加密概念股每日观察:俄罗斯央行拟出台数字资产交易新规,设立高门槛“数字托管所”
交易流程标准化:交易所须以自有规则手册确定市场计价 根据俄罗斯央行最新出台的条例草案,未来所有在俄境内从事数字资产与数字权利有组织交易的平台,必须彻底告别过去的粗放运营模式。 草案明确规定,交易所必须
-
 SK海力士Q2 利润暴增六倍仍“未达标”,与 10 家客户敲定长协,HBM4 下半年将加速放量
作者:鲍弈龙SK海力士二季度运营利润创历史新高,但仍未达分析师预期,市场对AI芯片需求能否持续支撑高估值的疑虑进一步加深。 7月28日美股盘后,SK海力士公布二季度财报,运营利润同比激增557%至60
-
 Robinhood 加密负责人亲述:Meme 代币化美股为“杠铃”获客策略,各业务线都已做到上亿收入
原文标题:Johann Kerbrat: Inside Robinhood's Crypto Strategy (Full Explanation)原文来源:TheRollup原文编译:深潮 Tech

- 成交量排行
- 币种热搜榜
 泰达币
泰达币 比特币
比特币 以太坊
以太坊 USD Coin
 Solana
 瑞波币
瑞波币 Ronin Network
 币安币
币安币 World Liberty Financial USDv
 莱特币
莱特币 艾达币
艾达币 狗狗币
狗狗币 大零币
大零币 Wormhole
 比特现金
比特现金 SHIB
SHIB UNI
UNI OKB
OKB AR
AR ICP
ICP DOT
DOT LUNC
LUNC YGG
YGG DYDX
DYDX LPT
LPT ETC
ETC